Observability isn’t a new problem, and NestJS is certainly not the first ecosystem to tackle it.
But NestJS Observe is interesting because it asks a more specific question: what happens when observability understands the framework it’s observing?
Before looking at the implementation, let’s establish the problem and why framework context might matter.
The Observability Problem
If you’ve built and maintained a server application long enough, you’ve probably experienced moments when your API is slow for some reason and you don’t understand why.
You check the logs, and there’s nothing obvious. The database is up, and there are no errors. The endpoint works perfectly on your machine.
So you add a few logs:
11:30:02 AM LOG Starting order creation
11:34:11 AM LOG Inventory checked
11:34:12 AM LOG Payment started
11:39:03 AM LOG Payment completed
And you run the request again. Now you have a pretty good idea where the time went, but you’ve also just started building your own primitive tracing system.
That’s where things get interesting. Modern applications can produce enormous amounts of information: logs, metrics, traces, profiles, errors, database queries, HTTP calls, background jobs, queue messages, and more.
The challenge isn’t necessarily collecting more information. It’s being able to answer a much simpler question:
What exactly happened inside my application?
For a NestJS app, this question becomes particularly interesting because Nest already understands a lot about what’s happening.
It knows about controllers, providers, middleware, guards, interceptors, and pipes. It knows when a GraphQL resolver is executed, or when a microservice handler receives a message.
So what happens if observability is allowed to use that knowledge? That’s the idea behind NestJS Observe. And that’s what we’re going to explore in this article.
But rather than treating Observe as just another package to install, we’re going to use it to understand a bigger idea and question: what does framework-aware observability actually give us, and when is it worth using?
We’ll start with the basics of observability, build a small NestJS application, introduce a real performance problem, instrument it with Observe, and then compare the approach with the more framework-neutral world of OpenTelemetry.
Prerequisites
To follow along, you should have basic TypeScript and NestJS knowledge, and some familiarity with HTTP APIs.
You don’t need prior observability experience. We’ll introduce the concepts as we build.
What We’ll Cover
- The Observability Problem
- What Problem Is Observe Actually Solving?
- From Application Monitoring to Framework-aware Observability
- Meet NestJS Observe
- Our Practical Project
- Let’s Put Observe to Work
- How to Go Beyond the First Trace
- Where Observe Fits: NestJS, OpenTelemetry, and the Broader Ecosystem
- How to Evaluate Observe in a Real Application
- Final Thoughts
What Problem Is Observe Actually Solving?
Let’s make the problem concrete. Imagine this NestJS application: a POST /orders request comes in and takes three seconds. That’s all our HTTP client tells us.
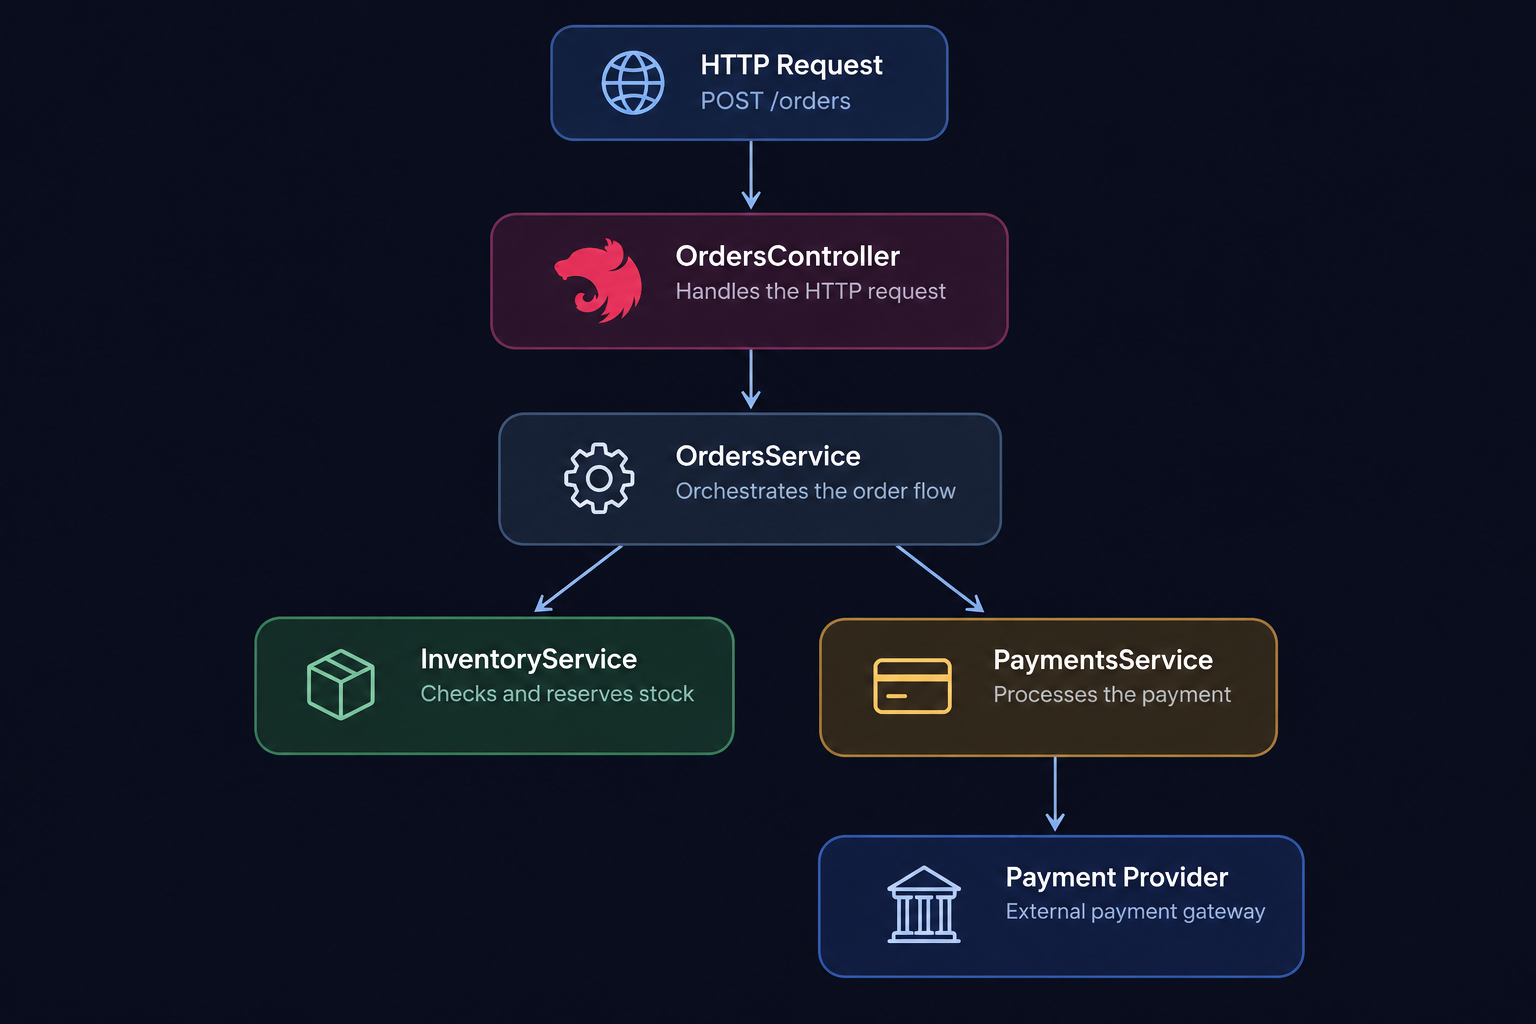
The diagram above shows how a single POST /orders request can trigger several layers of work inside an application, illustrating why the request duration alone doesn’t tell us where the time was spent.
What we know:
POST /orders → 3 secondsBut that isn’t enough. We want to know whether the three seconds came from:
Controller → Service → Databaseor:
Controller → Service → External APIor perhaps from something entirely different:
Node.js process → CPU-heavy operation → Event loop contentionThis is the problem observability tries to solve. And NestJS Observe approaches it from an interesting position: The framework already knows part of the answer.
Observability is one of those engineering words that can quickly become vague. A useful definition would be:
Observability is our ability to understand the internal state and behavior of a system from the information it exposes.
That information is called telemetry, and the most common telemetry signals are:
- logs
- metrics
- traces
- profiles
They all answer different questions.
Logs describe events: what happened?
For example:
2026-08-31 14:21:04
Payment provider returned HTTP 502
This is useful, but if you’re investigating one request, you may still have to manually connect this log to everything else that happened.
Metrics aggregate information: how often did it happen?
request_count = 1,240,231
error_rate = 2.4%
p95_latency = 840ms
Metrics are excellent for understanding trends, so you can quickly answer “Did latency increase after yesterday’s deployment?”. But a metric doesn’t usually explain the complete story of one request. That’s why we also need traces.
A trace follows one logical operation: what happened during this operation?
For example:
POST /orders
│
├── authentication
├── OrdersController.create()
├── InventoryService.reserve()
├── PaymentService.charge()
└── Payment API
Now we’re able to see the execution path. More importantly, we can see how long individual operations took.
Then we have profiles. Profiling answers a different question: where’s the runtime spending resources? Suppose an endpoint is slow, but there’s no obvious slow database or HTTP request.
A CPU profile might reveal:
CPU
│
├── JSON serialization
├── application code
├── garbage collection
└── cryptographic operations
The four signals complement one another.
This is a useful mental model:
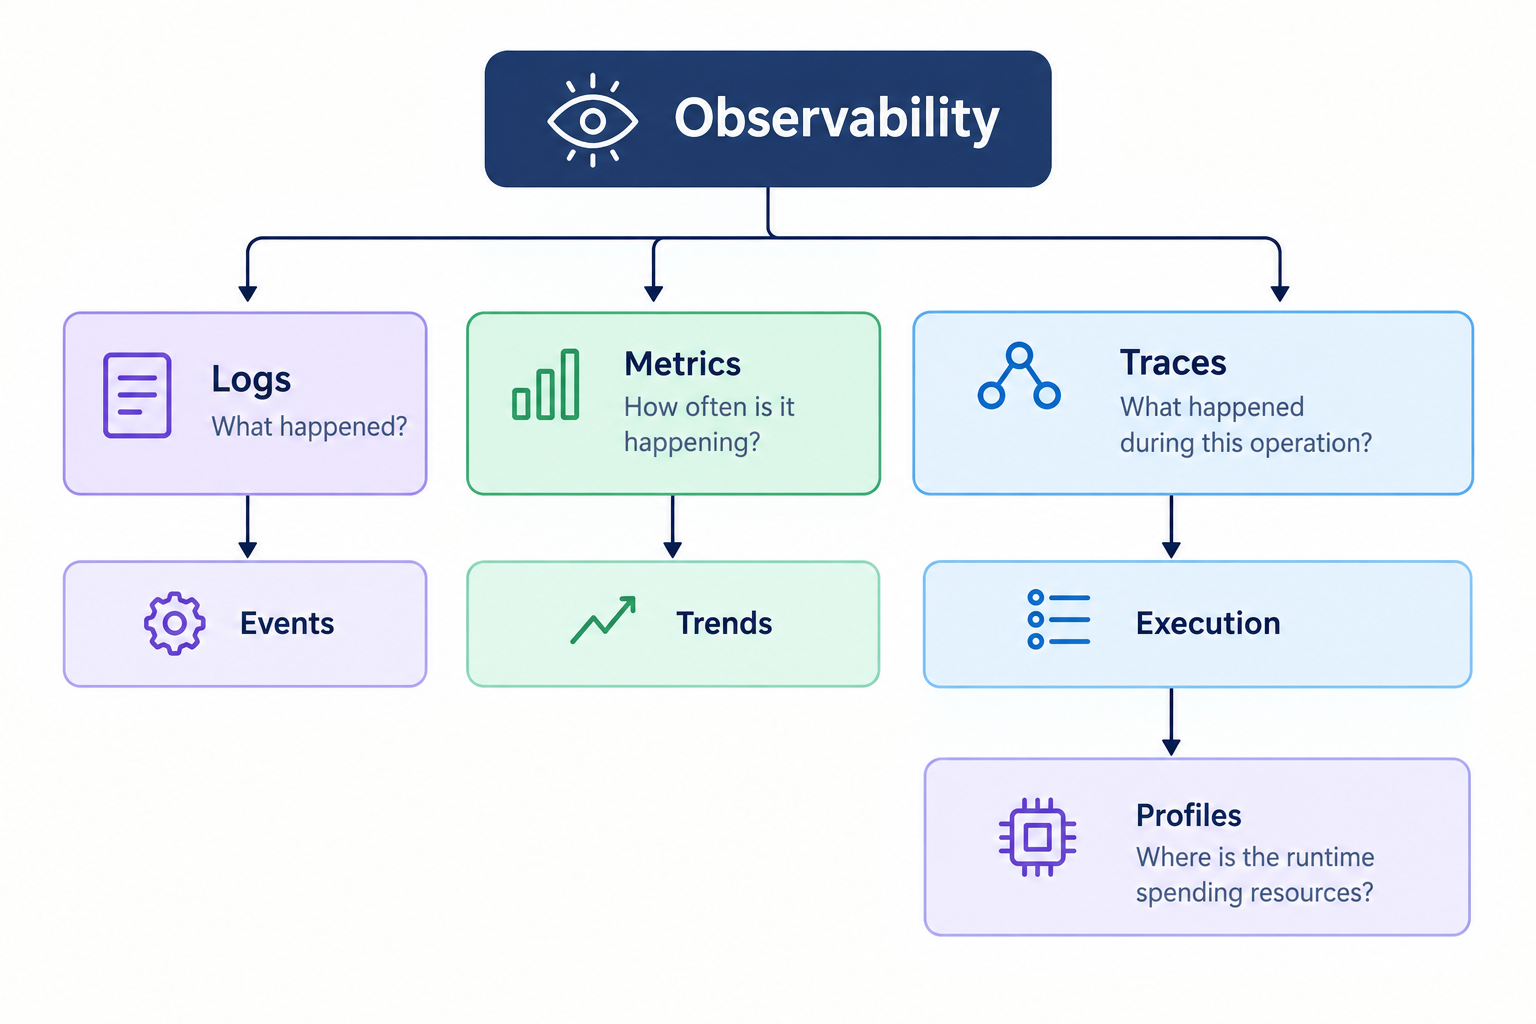
This illustration groups the main observability signals — logs, metrics, traces, and profiles — showing how each provides a different view of application behavior and how they complement one another.
In fact, you don’t necessarily need every signal for every application. The point is to have enough information to answer operational questions.
From Application Monitoring to Framework-aware Observability
The traditional approach gives us powerful, standardized ways to collect telemetry. But frameworks already understand how our applications are structured and executed. What if observability could use that context instead of treating the application as a generic process?
Before Observe
There are several ways we could approach our slow /orders endpoint. The simplest is logging:
console.log('Starting payment');
await paymentService.charge();
console.log('Payment completed');
It works until the application grows. Then we might introduce metrics:
payment_latency_ms
orders_created_total
payment_failures_total
Now we can understand behavior across many requests. Then we might introduce distributed tracing:
POST /orders
│
├── OrdersController
├── OrdersService
└── InventoryService
Each of these approaches is valid. But they share a common limitation: they require the developer to manually instrument every layer they want visibility into. The framework itself provides no telemetry by default.
So Why Do We Need NestJS Observe?
Manual instrumentation has real costs. Every span you create, every metric you register, and every log you write has to be written, maintained, and kept consistent as the application evolves. In a growing NestJS codebase, this adds up quickly.
NestJS already has rich metadata about your application’s structure — it knows your controllers, your providers, your guards, and your interceptors. The question NestJS Observe asks is: why not put that metadata to work for observability?
Framework-aware Observability
Framework-aware observability means the observability tooling understands the structure of the framework it’s instrumenting. Instead of treating the application as a black box of Node.js processes, it can instrument NestJS concepts directly.
This has a practical consequence: you get meaningful telemetry for your controllers, services, guards, and interceptors without writing instrumentation code for each of them individually.
Meet NestJS Observe
NestJS Observe is a library built specifically for NestJS applications. It integrates with the framework’s lifecycle to automatically produce telemetry for NestJS concepts like controllers, providers, middleware, guards, interceptors, and pipes.
It is built on top of OpenTelemetry, which means the telemetry it produces is vendor-neutral and can be sent to any compatible backend: Jaeger, Zipkin, Tempo, Honeycomb, Datadog, and others.
The key design decision is that Observe treats NestJS abstractions as first-class telemetry concepts. A span isn’t just “some code ran” — it’s “the OrdersController.create method ran as part of handling POST /orders.”
Our Practical Project
To see how this works in practice, we’ll build a small NestJS application that processes orders, introduce a realistic performance problem, and then instrument it with Observe.
Create the NestJS Application
Start by scaffolding a new NestJS project:
npm i -g @nestjs/cli
nest new orders-api
cd orders-api
Add Inventory
Create an inventory module that simulates checking stock:
nest generate module inventory
nest generate service inventory
Add a simple inventory service that introduces a realistic delay:
@Injectable()
export class InventoryService {
  async reserve(productId: string, quantity: number): Promise<boolean> {
    // Simulate database or external inventory check
    await new Promise(resolve => setTimeout(resolve, 200));
    return true;
  }
}
Create the Orders Service
nest generate module orders
nest generate service orders
The orders service coordinates inventory and payment:
@Injectable()
export class OrdersService {
  constructor(
    private readonly inventoryService: InventoryService,
    private readonly paymentService: PaymentService,
  ) {}

  async create(order: CreateOrderDto) {
    const reserved = await this.inventoryService.reserve(
      order.productId,
      order.quantity,
    );

    if (!reserved) {
      throw new Error('Inventory unavailable');
    }

    return this.paymentService.charge(order.total);
  }
}
Create the Controller
@Controller('orders')
export class OrdersController {
  constructor(private readonly ordersService: OrdersService) {}

  @Post()
  create(@Body() createOrderDto: CreateOrderDto) {
    return this.ordersService.create(createOrderDto);
  }
}
Test the Application
Start the application and send a test request:
npm run start:dev
curl -X POST http://localhost:3000/orders \
  -H "Content-Type: application/json" \
  -d '{"productId": "abc123", "quantity": 1, "total": 49.99}'
We Already Have a Problem at a Smaller Scale
Even in this simple application, you’ll notice the response takes longer than expected. But without instrumentation, all you know is that POST /orders took some number of milliseconds. You don’t know which part of the request was slow.
The Basic Solution: Logging
You could add timing logs manually:
async create(order: CreateOrderDto) {
  const t0 = Date.now();
  const reserved = await this.inventoryService.reserve(order.productId, order.quantity);
  console.log(`Inventory check: ${Date.now() - t0}ms`);

  const t1 = Date.now();
  const result = await this.paymentService.charge(order.total);
  console.log(`Payment: ${Date.now() - t1}ms`);

  return result;
}
This works, but it scales poorly. As the application grows, you end up with timing logs scattered across every service method.
What a Trace Gives Us
A trace structures this information automatically and links it to a single request:
POST /orders (total: 820ms)
│
├── InventoryService.reserve (210ms)
└── PaymentService.charge (590ms)
    └── External payment API (580ms)
Now you can see at a glance that almost all of the latency came from the external payment API, not from your application code.
Let’s Put Observe to Work
Configure Observe
Install the Observe package and its dependencies:
npm install @nestjs/observe @opentelemetry/sdk-nodeInstrument the Nest Application
Initialize Observe before the NestJS application bootstraps. This is important — the SDK must be started before any modules are loaded:
// instrument.ts
import { ObserveSdk } from '@nestjs/observe';

ObserveSdk.start({
  serviceName: 'orders-api',
});
Then import the instrumentation file at the top of your main.ts:
import './instrument';
import { NestFactory } from '@nestjs/core';
import { AppModule } from './app.module';

async function bootstrap() {
  const app = await NestFactory.create(AppModule);
  await app.listen(3000);
}
bootstrap();
Add the ObserveModule to your AppModule:
import { ObserveModule } from '@nestjs/observe';

@Module({
  imports: [
    ObserveModule.forRoot(),
    InventoryModule,
    OrdersModule,
  ],
})
export class AppModule {}
Generate Some Traffic
Restart the application and send a few requests:
for i in {1..10}; do
  curl -s -X POST http://localhost:3000/orders \
    -H "Content-Type: application/json" \
    -d '{"productId": "abc123", "quantity": 1, "total": 49.99}'
done
With a local Jaeger instance running, you can open the Jaeger UI at http://localhost:16686 and see traces for each request, broken down by NestJS component.
The Important Part Isn’t the Dashboard
The useful insight here is what Observe produces automatically. Without writing any span creation code, you get traces that include:
- The HTTP request itself
- The controller method that handled it
- Each service method that was called
- The duration of each operation
This is the framework-aware difference. A generic OpenTelemetry setup would give you the HTTP layer. Observe gives you the NestJS layer.
How to Go Beyond the First Trace
Automatic Instrumentation vs Manual Instrumentation
Observe provides automatic instrumentation for NestJS abstractions, but you’ll often want to add custom spans for operations that fall outside those abstractions — a complex computation, a third-party SDK call, or a background job step.
You can use the standard OpenTelemetry API for this:
import { trace } from '@opentelemetry/api';

const tracer = trace.getTracer('orders-api');

async processOrder(order: Order) {
  return tracer.startActiveSpan('processOrder', async (span) => {
    try {
      const result = await this.doWork(order);
      return result;
    } finally {
      span.end();
    }
  });
}
Because Observe is built on OpenTelemetry, your custom spans appear in the same trace as the automatically generated ones.
Metrics: When Traces Aren’t Enough
Traces are excellent for understanding individual requests. But if you want to answer questions like “how many orders were created in the last hour?” or “what’s the p99 latency for payment processing?”, you need metrics.
Observe exposes OpenTelemetry metrics APIs, so you can register counters and histograms alongside your traces:
import { metrics } from '@opentelemetry/api';

const meter = metrics.getMeter('orders-api');
const ordersCreated = meter.createCounter('orders_created_total');

async create(order: CreateOrderDto) {
  const result = await this.ordersService.create(order);
  ordersCreated.add(1, { product: order.productId });
  return result;
}
Errors Are Also Telemetry
Exceptions are telemetry signals too. When a payment fails or inventory is unavailable, that information should appear in your traces and metrics automatically.
Observe captures unhandled exceptions and attaches them to the active span. You can also record errors explicitly:
import { trace, SpanStatusCode } from '@opentelemetry/api';

try {
  await this.paymentService.charge(order.total);
} catch (error) {
  const span = trace.getActiveSpan();
  span?.recordException(error);
  span?.setStatus({ code: SpanStatusCode.ERROR, message: error.message });
  throw error;
}
Beyond HTTP: Following Work Across Your Application
Most NestJS applications don’t just handle HTTP. They process queue messages, run scheduled jobs, and call microservices. Observe can instrument these too, propagating trace context across message boundaries so you can follow a single logical operation from an HTTP request through a queue message to a background job.
Where Observe Fits: NestJS, OpenTelemetry, and the Broader Ecosystem
It’s worth being direct about the trade-offs here.
OpenTelemetry is the vendor-neutral standard for observability instrumentation. It has broad ecosystem support, works across languages and frameworks, and is the right choice if you need portability or if your team already has an OpenTelemetry-based observability stack.
NestJS Observe sits on top of OpenTelemetry. It doesn’t replace it — it adds a NestJS-specific instrumentation layer. The telemetry it produces is still OpenTelemetry-compatible and can be sent to any OpenTelemetry-compatible backend.
The trade-off is specificity versus generality. Observe gives you more meaningful out-of-the-box telemetry for NestJS applications. A generic OpenTelemetry setup gives you more control and more portability.
For teams working entirely within the NestJS ecosystem, Observe reduces the instrumentation burden significantly. For teams with mixed stacks or strong opinions about their observability tooling, the generic OpenTelemetry approach may be preferable.
How to Evaluate Observe in a Real Application
Before adopting any observability library in a production application, it’s worth asking a few practical questions.
What does it instrument automatically? Understand which NestJS abstractions Observe instruments out of the box: controllers, providers, guards, interceptors, pipes, and middleware. Know which layers require manual instrumentation.
How does it affect performance? Every instrumentation layer adds overhead. Measure the latency impact in your application before enabling Observe in production. OpenTelemetry SDKs are designed to be low-overhead, but the actual cost depends on your export configuration and sampling strategy.
Where does the telemetry go? Observe produces OpenTelemetry-compatible telemetry, but you still need to configure an exporter and a backend. Decide early whether you’re using a managed service like Honeycomb or Datadog, or a self-hosted stack like Jaeger and Prometheus.
How does it interact with your existing instrumentation? If you already have logging, metrics, or tracing in place, understand how Observe will coexist with those systems. In many cases, Observe can complement rather than replace existing instrumentation.
Final Thoughts
Observability is ultimately about reducing the time between “something is wrong” and “I know exactly what happened and why.” Logs, metrics, traces, and profiles each contribute to that goal from different angles, and effective observability usually means using several of them together.
NestJS Observe takes a specific approach to this problem: it uses the framework’s own understanding of the application to produce more meaningful telemetry with less manual instrumentation. Whether that trade-off is right for your application depends on your team’s existing tooling, your observability requirements, and how much of your stack lives inside NestJS.
The broader lesson is that the best observability strategy is the one that actually gets implemented and maintained. Automatic instrumentation that your team understands and can extend is more valuable than a theoretically perfect setup that nobody touches. Start with what gives you visibility into the questions you’re actually trying to answer, and build from there.